Chartreading 101: Pivots and market structure
Many traders and analysts, and most casual traders have no idea how to really read a chart. For most people, chart reading involves some variation of looking for a handful of favorite patterns on charts. Others are simply overwhelmed by the mass of information and have no idea how to sort out what is really significant from the hundreds of small details and random noise. Large buyers and sellers, whose actions really determine the price of a stock, leave tell-tale patterns in the prices of stocks. Chart patterns can be powerful tools to understand the relative conviction of these two groups, and to get some advance warning of when their convictions wax and wane. Nothing works all the time, but this provides the trader with a tremendous potential edge in the market that, properly applied, can lead to consistent profits.
The first important concept is a swing high or swing low, which can also be called a pivot (or a pivot high or low). This tiny, seemingly insignificant little pattern is the most fundamental element —the very building block of market structure. One of the most interesting things to notice about a market is what happens when it moves past prior support or resistance. If, for instance, buyers push the market through resistance but the move immediately stalls out, then we are able to define an important “high water mark” that shows where the bears temporarily won the battle. On a chart, the previous bar’s high and low always represent support and resistance (though sometimes only minor), so we can define a swing high as a bar whose high is higher than the bar before and the bar after. Old-school, the analyst would have gone through the charts with a pencil and put a “ring” above and below these points, so these are sometimes called “ring highs and lows”, but are marked on the chart below with dots above and below the bars.
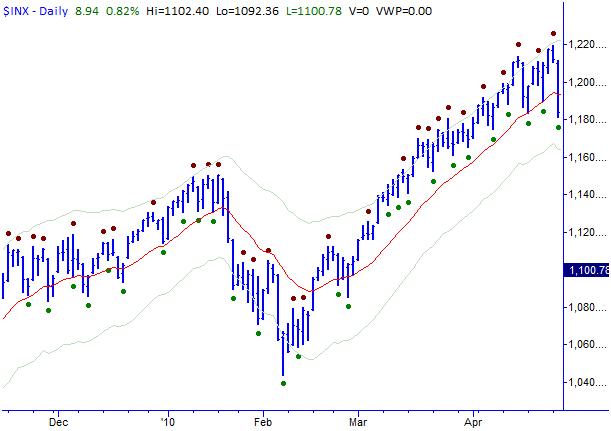
Click picture to view in full size
Exercise 1: Take 10 charts of markets of your choosing and mark every swing high / low on the charts. Use the following timeframes: 1 minute, 3 minute, 5 minute, 30 minute, 78 minute, daily, weekly, monthly at your discretion, but make sure to only use the lower timeframes on active markets.
We can see several interesting facts about these swing highs and lows. First, it is not possible to define them until the next bar has closed, meaning that there is no way to tell if the current bar may represent a swing point until the next bar closes. Second, these vary in importance. Some are insignificant, and would be missed by a casual glance at the chart while some are very obvious and important. If we consider the basic swing point to be a short-term high, we can define intermediate term highs as a swing high immediately preceded and followed by lower swing highs. The intermediate term highs and lows are marked on the chart below with “old school” ring-style pencil markings:
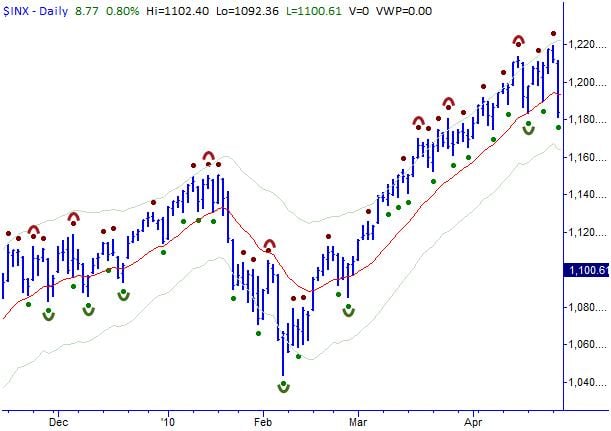
Click picture to view in full size
Exercise 2: Take the charts from ex. 1 and mark the intermediate term swing highs and lows on the chart.
This idea obviously can be extended to long-term highs, which are intermediate term highs surrounded by lower intermediate term highs:
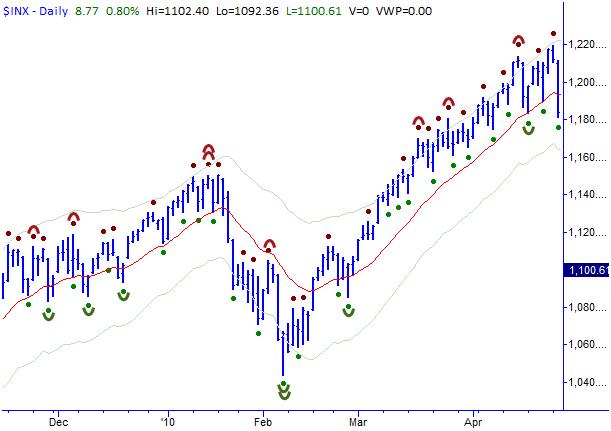
Click picture to view in full size
Exercise 3: Take the charts from ex. 2 and mark the long-term highs and lows on those charts.
So far, everything has been very rule-based and detail-oriented, but now we move into something that is slightly more discretionary. The reason for devoting such much attention to these intermediate and longer term swing points is that they show the points where buyers finally overcame sellers on the downside and vice versa to the upside. These points are important because they will act as support and resistance on the next swing, and, by noticing how the market acts around these critical levels, the trader can begin to understand who is really in control of the market.
We can connect the intermediate term highs and lows with lines to show the underlying structural swings in the market. This requires some flexibility because sometimes there will be no intermediate term low in between two intermediate term highs, in which case you can pick another significant swing low to anchor the downswing. There also may be the occasional swing high or low that technically fits the rules, but is not incredibly significant on the charts. In this case, you may ignore that point in drawing swings. Ideally, you will have swings that tend to change direction every 3-10 bars on average, though it will depend on the market conditions at the time. One possible way to delineate the swings in the charts above is shown here:
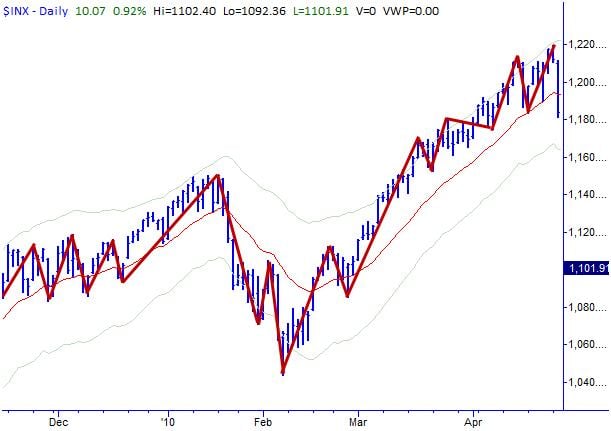
Click picture to view in full size
Exercise 4: Create swing charts by connecting intermediate term highs and lows on all the charts from ex. 2. When you have to make an adjustment or adaptation for the placement of a pivot, write a short note explaining your decision and why it was better than an alternative. (There is usually not one right answer, but there certainly are wrong answers, and the thought process is most important.)
The patterns introduced here are not as exciting as some you may have seen in other books or other websites. The truth is that those patterns do not work as many authors would have you believe, and focusing your trading career on those patterns will not train your eye to see balance and imbalance on the chart. This is slow going at first, but, over a lot of time, will lead to intuition about the underlying market structure and future direction of prices. There certainly is information to be gleaned from the details of each bar and its relationship to the surrounding bars, but in most cases the big-picture market structure dominates. Even if the details are important, they are most meaningful in context of the big picture, so it is worth your time to invest a lot of energy into learning to see swing points and market structure in any chart
No comments:
Post a Comment