Price Action: Trends and Trading Ranges
In the last lecture, we introduced a rule based approach to highlight the fundamental market structure on the chart of any market in any timeframe. Today, we will expand this concept by putting that market structure in the context of trends and trading ranges. Trades that will work in trends will fail in trading ranges, because price action in a trend is nearly the exact opposite of trading ranges. In fact, many trading losses stem from applying tools that are appropriate in a trending environment to a trading range, and vice versa, so we will spend some time today look at that critical interface where trends become trading ranges and trading ranges break out into trends.
Markets are always either trending or in trading ranges. There is no in between, though there is often confusion and ambiguity at many points. A good working definition of a trend is that it is a series of price changes that move the market from one price to another. Trends can last years or seconds, many bars or just one, but the distinguishing feature of trends is that they start at one price and end at another. Trading ranges, on the other hand, are areas where price action moves back and forth through the same price multiple times. You should think of trends as directional moves, while viewing trading ranges are sideways price action. Trends tend to be somewhat more predictable than trading ranges, which have a much higher ratio of noise. (We will refine these definitions later in this lecture into a more precise rule set.)
Trends do not move in straight lines, but in a series of “impulse moves” in the direction of the trend, followed by pullbacks or counter-trend moves in the opposite direction. This leaves a telltale pattern of higher highs and higher lows (for an uptrend) on the chart.
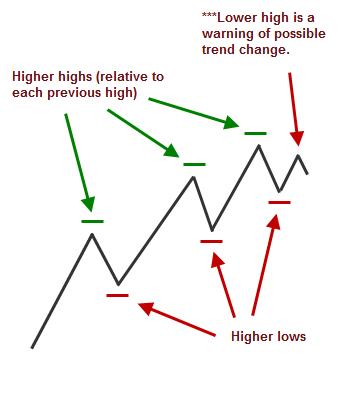
Why is this pattern powerful? Each up leg is a result of buyers bidding the market up, being willing to pay ever higher prices as sellers lift their offers. On the pullbacks, buyers take a break from active buying and the market naturally floats back down when the buying pressure comes off. At some point, buyers resume their buying campaigns and start pushing the market up again. If the market turns back up and buyers are not so interested in paying higher prices, this will show on the charts clearly because the market will not trade as high as it did on the previous swing, leaving an upswing that is shorter than the previous upswing and a lower high on the charts.
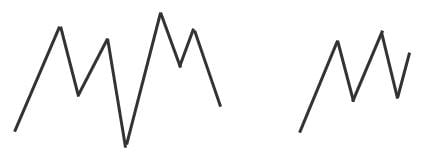
Swing trading is a much misused term, but it technically refers to a kind of trading that focuses on the next swing in the market, or the next leg. The core concept of swing trading is to try to gauge the relative conviction of bulls and bears by looking at the length, speed and volume of each swing to see if there should be follow through after the pullback. In other words, if the market is on an upswing, but we realize this upswing is losing momentum compared to previous swings, we would not establish long positions into the next pullback. After a loss of momentum, the following upswing would more likely be a better place to enter some initial shorts in an effort to catch a trend change. Of course, this is greatly oversimplified, but these core concepts of length of swing are the basis for most swing trading systems.
In trading ranges, prices tend to stop at support and resistance levels that define the edge of the trading range. It might seem like a good plan is to buy support and sell resistance, but some of the most difficult trading happens in ranges. For one thing, support may often drop (or resistance lift) a small amount to flush out weak longs, and a new support level holds just underneath. It is also possible to successfully buy support, and then find that resistance is now holding in the middle of the range, so your profit potential is much less than you thought. In general, trading range price action is extremely random and most developing traders will be better served by focusing on with-trend price action until they have achieved consistent profitability.
To recap, the key points to remember are:
• Markets are always either trending or in trading ranges.
• Trends are a series of price changes that move prices from one level to another.
• Trends are visible on charts as a series of higher highs and higher lows. (The reverse is true for downtrends.)
• In an uptrend, the upswings are longer than the downswings.
• Trading ranges define support and resistance areas that tend to stop prices, but these areas are usually not exact prices.
• The best and easiest trades are with-trend trades.
The simple definition of a trend as price action that moves from one price to another is useful, but not very precise. If we use our understanding of pivots and market structure (lecture 3), we can also say that a trend is price action that shows higher highs and higher lows on a chart. Schematically, a trend looks like this:
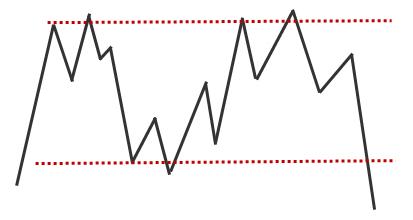
A trading range, then, is any price action that does not fulfill the requirement of higher highs and higher lows, or lower lows and lower highs for a downtrend. There are many possible variations of trading range patterns:
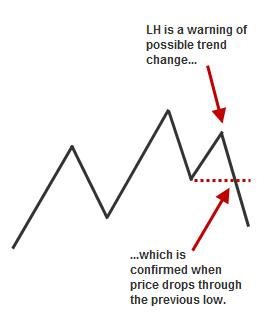
Using these definitions, the classic trend change follows a predictable sequence:
1. The market is in an established uptrend, with a clear pattern of higher highs (HH) and higher lows (HL).
2. The market breaks the pattern. On the upswing, it might fall short of the previous high and put in a lower high (LH), or the downswing might violate support with a LL. Either way, the clear uptrend pattern is now broken and we are, officially, in a trading range. Note that either the LH or LL is only a warning of possible trend change, though many traders will prematurely assume the trend has changed.
3. The actual trend change occurs when the pattern shifts to a downtrend, in both cases by dropping support. If the market failed to trade through resistance, trend change is confirmed when the previous HL is violated, as now there will be a LL whenever the market turns back up.
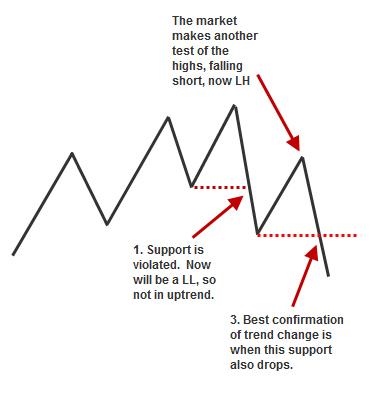
4. If the uptrend ended with a thrust through support, the pattern is potentially more complicated. The market must make another test of the highs, failing there (leaving a LH) and then, again, trading through support to confirm the trend change. This pattern could look like this:
What we have just outlined is a good, theoretical, working definition of a trend change. It is worth your time to study this concept and apply it to many real charts because you will get a valuable high-level perspective from this understanding of market structure, but it is important to also realize that this is theory and not practice. It is important to consider some ways in which actual trading will be more challenging than finding these patterns on simple line charts.
First, there are many variations of failed trend change patterns. Just because the theoretical pattern has shifted to a downtrend does not mean the market will go down. It is certainly possible for a market to stop uptrending, make a series of LH and LL, and then explode back off a test of one of those lows and resume its strong uptrend. (Though we are getting ahead of ourselves here, this pattern is actually a powerful buying pattern as it is how a higher timeframe consolidation in a trend looks on the lower timeframe.)
In your homework for these first few weeks, be rigid with these rules based on relationships to previous swings, but in actual trading we pay more attention to length of swing and loss of momentum. For instance, an uptrending market will often show a loss of momentum (maybe breaking a trendline), make a LL, and then turn back up to test the highs. In this lecture, we just said that the market technically needs to put in a lower high to confirm a trend change to downtrend, but many time the best possible spot to short is if the market makes a slightly higher high. Buyers will be trapped beyond that level, and as they scramble to hit out of their positions, their selling pressure will often greatly accelerate the decline. This theoretical structure is valid and important, but the bottom line is that we do not always make trading decisions based only on theory. Learn the foundation first and then the trades that set up around this framework will make much more sense down the road.
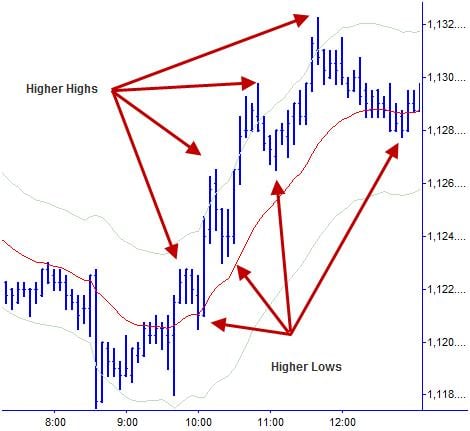
Let’s take a look at how these concepts might be applied to an actual price chart:
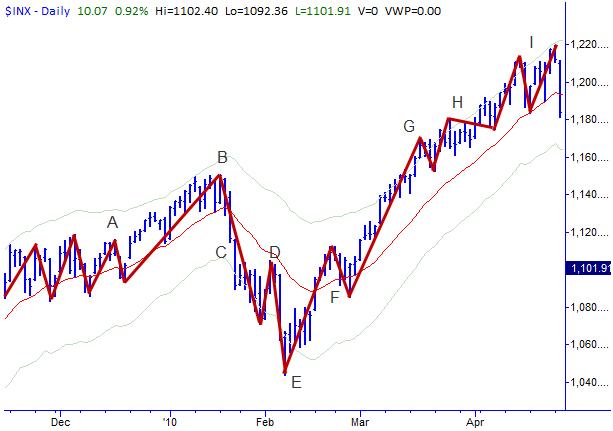
A – the market has been in a trading range for some time, but we see the top and bottom of the range are not clearly defined. You cannot see on this chart, but a significant uptrend preceded this range. We usually expect trading ranges to break out in the direction of the trend that preceded them.
B—It looks like we got our upside breakout. The market traded above the top of the range defined at A, pulled back to test (just before the beginning of 2010), and then traded higher. We have now had two trend legs up from the trading range, and at B we seem to be seeing some triple-top kind of action, which is just a resistance area becoming important. We expect prices will pull back, and if they can hold (roughly) above the A range, we should be able to buy for another push up.
C—Well, it seems everyone had the same plan. When the market dropped below the top of the range, a large range day carried prices almost to the bottom of the range. We are no good on the long trade now, since we have had a failure above the top of the range. Now we will need to see if the bottom of the range holds.
D—The bottom of the range actually dropped, but price did not fall too far below without trading back up in a pullback. This pullback to D should be short-able, but it is not a high probability trade.
E—The pullback at D was good and we go another trend leg down. Looking to see if we can get another pullback that holds below D, for another possible short.
F—D did not hold as resistance, and now we are back within the confines of support and resistance defined by the range at A. The pullback following F could be buyable due to the failure of the bears to put together another push below E, but chances are we are just in an extended trading range.
G—A very strong trend leg extends up to G. Now a high probability trade to buy the first pullback, which does hold above B. This is not a very deep pullback, so would be a difficult buy, but the concept is sound.
H—A higher high, but on a shorter trend leg. Trend is still up, but perhaps losing some momentum.
I—A good extension up, but the pullback is too deep. Not a great buy, and if bought should only be held for a scalp.
Exercise 1- Take 10 charts (1,3,5,30,60,Daily,Weekly) and clearly mark all areas on the chart as either trends or trading ranges.
Exercise 2- Take 2 of the charts from exercise 1, identify the points where the market shifts from trend to trading range and vice versa. Describe in detail the price action (in terms of previous highs/lows, length of swing, support resistance levels) the changes the market from trend to trading range. Use the discussion at the end of this lecture as a guide to detail and style.
Exercise 2- Take 2 of the charts from exercise 1, identify the points where the market shifts from trend to trading range and vice versa. Describe in detail the price action (in terms of previous highs/lows, length of swing, support resistance levels) the changes the market from trend to trading range. Use the discussion at the end of this lecture as a guide to detail and style.
No comments:
Post a Comment