First Principles of Technical Analysis: The building blocks of market structure and price action.
Technical analysis is the art and science of predicting the future direction, timing, and/or magnitude of a market’s movements, mainly by using information contained in the price changes of that market. The term technical analysis is used to differentiate this approach from fundamental analysis, which focuses on analysis of items such as financial statements, competitive advantage, a company’s management, supply and demand factors, and an understanding of the overall economic environment. There are die-hard adherents of each school who claim that their approach is the only one that makes sense, and that the other school is completely worthless. In reality, most traders use a combination of the two, and the goal of both of these approaches is the same—to try to understand the forces of supply and demand at work in the market.
For very short-term traders, fundamentals usually do not matter because the day to day price path of stocks does not depend on elements of their balance sheet, superiority of management, or even the company’s competitive position within its industry. Longer term investors will tell you that the short term fluctuations of stocks are illogical and are completely random noise, but we know from careful observation of prices that buyers and sellers leave many clues to their intentions. There are verifiable statistical edges to certain kinds of technical analysis, but they must be applied in a precise and disciplined fashion, because the edges are very small indeed. There is no such thing as a 75% edge in the market—even 55% is uncommon.
It is very easy to find books (Amazon lists over 17,500), websites, seminars, and classes on technical analysis. You probably hear your friends talking about great trades they have made when the moving averages are set up a certain way and the stochastic fast line crosses some other line… this is what most people think of when they think of technical analysis. Be very careful. There is a huge difference between finding trading “setups” that look good on historical charts and actually placing these trades in real time. As traders, we do not have the luxury of going back through charts to find the best examples—we must live and work at the “hard right edge” of the chart where the future, the very next tick, is unknowable.
Unless you have made substantial, consistent money with a technical tool (consistent being the key word), this might be a good opportunity to throw it out and start over. 99.99% of what you read or have been told about technical analysis is worthless. There is no statistically verifiable edge in common oscillator or moving average patterns. There is no statistical edge to the common candlestick patterns. There are no magic chart patterns that can make sense of the randomness. This is the bad news is—that almost everything everyone thinks works in the market, simply does not. However, the good news is that it is possible to find an edge in the market that can lead to a consistent trading advantage. The key to this is to understand how the patterns of the market’s movement reveal the true buying and selling pressure, and this can give clues to future market direction. That is the core understanding of technical analysis, and it is just not possible to reduce this to a simple set of rules or patterns to be applied blindly.
Rather than focusing on specific trading patterns or setups, we want to lay out some basic principles that drive price action in all markets and all timeframes. These are not foolproof rules, but they do apply universally to stocks, futures, forex, cash commodities, bonds, or to any liquid market. We see these same principles driving price action on one minute bars or monthly bars. In addition, these appear to be fairly universal and unchanging. We see the same patterns in grain prices from the Middle Ages, or in stocks from the 1700’s that we see in today’s markets. Traders will of course need to adapt to new markets and new timeframes, but our goal here is to lay out a more or less universal framework that can provide a basis for trades in any market. These principles are: markets alternate between trends and trading ranges. Trends are more likely to continue than to end. Trends, when they do end, usually end in one of two specific ways. Lastly, we will lay out some characteristic price patterns around support and resistance holding or failing.
Markets alternate between trends and trading ranges. This principle of market behavior is responsible for many trading losses because what is right in one market “phase” is precisely wrong in the other—if you incorrectly identify the market context, you will place one losing trade after another. Understanding the difference between price action in trends and trading ranges and how the market moves between the two phases is really the first, and most important, skill in technical analysis. In general, fading (going against) moves both up and down is the correct strategy in a trading range where the market will tend to test support and resistance before turning back in the other direction. In a trend, that strategy will always put you on the wrong side of the market and losses will mount as the market moves farther and farther against you.
In trading ranges, support and resistance tend to hold. Ranges tend to contract as the market seeks out areas where selling pressure is sufficient to stop price advances or where buying will arrest declines. Mean reversion strategies (fade trades) tend to work in trading ranges as the market trades back and forth through the same price multiple times. It would seem to be easy to trade in ranges—just sell at resistance and buy at support and watch the pile of money grow. In reality, it is not that easy. Resistance may fail as the market breaks into an uptrend, putting the trader on the wrong side of a new and very vigorous trend. If the trader adds to shorts fading this new trend, losses can become truly… dramatic. On the other hand, there are many times where resistance fails, and the market trades a little bit higher to establish a new resistance area just above the old one. In this case, all that has happened is that the confines of the trading range have been expanded and the right play would have been to hold, or even to add to, shorts on the break. It is much easier to identify profitable trades in trading ranges after the fact than it is to place these trades in real time.
On the other hand, trends, once set in motion, are more likely to continue than to end. Traders love to pick tops and bottoms because it feels really good to have sold the high tick in Crude Oil or to have bought the very bottom in a pharmaceutical stock that melts down because it was denied an FDA approval, but trades like this are probably not how you are going to build your career. The best and easiest money is to be made with the trend. Identify trending markets and use the more or less predictable elements of trend structure to position yourself on the same side as the trend. Trading with the trend is more forgiving because the power of trend continuation allows you to be a little early or late on your entries and still make substantial profits. Given any chart, your first thought should be do identify the trend and to find ways to position yourself in that trend. Carefully examine your instincts. If you find yourself always wanting to fade the trend, you probably need to make some changes to your thought process or you are likely in for a short and painful career as a trader.
Rather than spending your time examining moving averages or looking for chart patterns, your mental energy in these first few weeks is best spent trying to understand what the characteristics of price patterns are in both trends and trading ranges. We will have more lectures and more trading plays built around these differences, but here are a few generalizations to get you started: In trends, the basic price pattern is an impulse move, a retracement against that impulse move, and then another trend leg in the original direction. One of the best technical trades there is comes from identifying impulse moves, entering on the counter-trend retracement against that move, and holding the trade as the market turns back in the direction of the impulse move. It is possible to build a trading career around this one very simple concept, so this is really worth a lot of your time and attention as a developing trader.
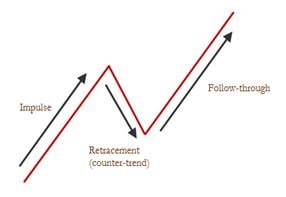
Figure 1. Basic trend structure
Of course, trends do end, and they tend to end in one of two predictable ways. Consider an established uptrend that has shown a clear pattern of impulse move up, retracements against the trend, and then new impulse moves that break resistance as the market trades to new highs. At some point, buyers will lose some interest and the market will start to stall around resistance. Perhaps resistance will still break, but the moves through will not be as sharp or as clean as they have been. If the pattern has been $0.50 moves through resistance, perhaps there is a series of moves that only go $0.30 and then $0.10 through resistance. We might characterize this market as being “tired”, or, in the language of technical analysis, momentum divergences are emerging on each upswing. Resistance is starting to hold against the trend, and eventually the trend will end.
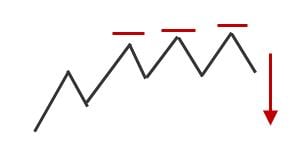
Figure 2. Resistance holding against trend
This is often a very quiet and polite way for trends to end, but trends can also end in dramatic climaxes. In this case, the trend accelerates into a series of more and more dramatic upmoves and goes “parabolic”. Emotions get very strong in a move like this (which is why you, as a successful trader, must learn to control your emotions and stand apart from the crowd), and it looks like the market is going straight to the moon. At some point, the last willing buyer has bought and a vacuum is created on the other side. The market immediately collapses as bulls, who were feeling giddy with excitement a few minutes ago, now panic as they realize they are caught on the wrong side of the trend.
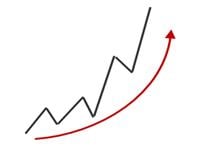
Figure 3. Market in "blowoff", parabolic move
To illustrate the perils of trying to pick tops and bottoms, imagine you successfully caught the top in that last blowoff trend. Now what? It is certainly possible that the uptrend will turn into an equally dramatic downtrend (anything is possible at any time in the market), but remember our first principle of market behavior: markets alternate between trends and trading ranges. It is far more likely that the top you caught will now lead to a sideways trading range than an actual trend reversal. Your capital (financial, mental, and emotional) will now be tied up in an unproductive trading range as you agonize over each tick. Once you are in that trading range, now you have to watch and see if it is likely to break out into continuation of the original trend or eventually start a new trend in the other direction. There is money to be made here, but it is hard money.
In trading ranges, it is important to be aware of how price acts around support and resistance levels. The characteristic pattern of S/R holding is “price rejection” at the level. Price trades near the level, and then immediately is pushed away in a sharp momentum move. Note that these levels do not have to hold cleanly. In fact, some of the best tests occur where price slightly penetrates the level, but there is a complete lack of conviction beyond the level. (This obviously has implications for where you might set your stops in trading ranges. It is not possible, in most cases, to stop out a tick beyond S/R, and you have to be prepared to re-enter if a level is penetrated and immediately fails.) This is not always how S/R holds, but this should be your basic mental template.
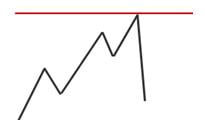
Figure 4. Price rejection at the level
If price goes quiet at the level, this is more indicative of impending failure. Buyers are able to hold the market near resistance as they accumulate more inventory, or sellers keep enough pressure on the market to keep it sitting on support. If you sell a test of resistance and the market does not back off very much, you probably should think about scratching the trade (taking either a very small win or loss.) You will also sometimes see a market sitting quietly on support for a long time. This can be boring price action that causes the public to completely lose interest in the market or the stock, but we know that this kind of action can set up a dramatic break of the level. Note that, here again, is another illustration of our first principle of price behavior in action. The quiet trading range at support often gives rise to a dramatic trend below support. It pays to pay attention to quiet markets sitting near important levels. Note also that this contradicts one of the time-honored principles of technical analysis you may have heard elsewhere, which is that a level is more valid the more times it is tested. In general, a good level should have the power to push prices immediately away from the level. If we see it back at the level three or four times, start thinking “we shouldn’t be back here,” and consider the possibility of a breakout trade.
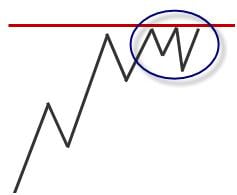
Figure 5. Schematic of price trading near a resistance level
The purpose of this lecture has been to introduce you to the basic concepts that drive price behavior in all markets and all timeframes. To recap:
- Markets alternate between trends and trading range.
- A trend is more likely to continue than to end.
- Trends tend to end in one of two ways: rollover or dramatic blowoff tops.
- If support or resistance are going to hold, there is usually price rejection at the level.
- Conversely, the market going quiet and trading near the level more often precedes failure of the level.
All of the patterns, all of the setups, all of the specific trading plays we have each center around one of these four basic trades. There are many different ways to set up or manage each of these trades, and each of them will work in specific environments. Your job as a trader is to understand the emerging market environment so that you know which of these trading scenarios is the correct one to apply, to enter the correct trades, and to manage the risk. Our job is to give you the tools to do that. In the next lecture we will look at how to set up your charts and dive into specific trading plays in a little more depth.
It is possible to simply all of this even further. Support or resistance levels can only break or hold, and they can do so only either in trends or in trading ranges. For technical traders, it is possible to classify every possible trade into one of four classes of trades. Every trade, no matter how complex or esoteric boils down to one of these:
S/R breaks in a trend  Trend Continuation Plays
S/R holds in a trend Trend Termination Play
S/R holds in a trading range S/R Holding Plays
S/R breaks in a trading range S/R Breaks (breakouts)
As technical traders, there are only four basic trades:
- Trend continuation
- Trend termination
- Support and resistance holding
- Support and resistance breaking
No comments:
Post a Comment