Saturday, April 30, 2016

Technical Analysis 101

Technical Analysis (more significant short term)
  • The discipline of predicting the most probable (60%) chance future direction, timing, and/or magnitude of market movements.
  • Main focus is on past movement contained in that market or markets
  • All market analysis focuses on probabilities not certainties.
What works with technical analysis
  • Buying and selling pressure are what move markets
  • Patterns are just formations formed by buying patterns
  • Trading is a game of probabilities not predicting
  • Understanding that trading success comes from trading skill not technical analysis
Fundamental Analysis (less significant on short time frames)
  • Balance sheet analysis
  • Quality of earnings, margins
  • SWOT analysis
  • Assessment of management
  • Competitive position in the industry
  • Profitability / Capital Structure
  • Highly specialized individuals tend to know more about stock than average investor has information to understand.
  • Not focused on stock price itself rather than fundamentals
FOUR principals of price behavior
  • Markets alternate between trending and trading ranges
  • Trends once in motion are more likely to continue than to end
  • Trends once they do end tend to end in one of two ways
  • There are characteristic patterns for support and resistance holding or failing
Why understand principals of price behavior is important
  • What works in a trend is exactly the opposite as what works in a trading range and vice versa.
  • If you incorrectly identify the market you are in.  You will lose.
  • Most traders / public tend to lose interest in a quiet market.  This however is exactly the point when stocks tend to break out and trend again.
  • Do not assume a change of trend when trend ends.  They tend to move into a trading range.
  • The easiest money is made trading with the trend.
  • You can make money fading a trend however this is much harder.
Two Ways Trends END
  • Resistance starts to hold and moves into a range.
  • Parabolic end with blow off top/bottom and subsequent sharp reverse in trend
Pattern around support and resistance holding
  • Price gets close to level and immediately gets pushed away with 3-5 bars.
  • Immediate sharp test of support which holds.
  • Sense that price doesn't want to be there.
Pattern around support and resistance failing
  • Price gets near a level and bounces once, than comes back again, and again, and consolidates right above or on the level.
  • Conventional wisdom say that the more times a level is tested the more valid it is. 
Four Basic Technical Trades
  • Support and Resistance break in a trend - Trend Continuation Trade
  • Support and Resistance holds in a trend - Trend Termination Trade
  • Support and Resistance hold in a range - S/R Holding Trade
  • Support and Resistance break in a range - S/R Breakout Trade
Trend Pullbacks
  • Earlier in trend bought earlier as people don't want to miss out
  • Later in trend bought later as many people are already in


Three Trades to Develop


Three Trades to Develop

Consolidation Break – Swing Trade

·         Stock with significant strength / weakness has now moved sideways with tighter ranges

·         Typically 3 – 4 days

·         Initial entry on close above KEY technical level

·         Alternate entries can be taken based on intraday levels with higher risk reward than closing entry

·         The underlying idea is the higher time frame trend will reassert itself

Important Takeaways

·         Offers very high risk to reward based on intraday analysis

·         Requires patience for short term day traders

·         Stay in trade until breaks below key level (Should be selling partial on way up)

Momentum Reversal Trade

·         Trade should work quickly

·         Stock that traders (momentum) piled into quickly getting in with the trend and are now quickly exiting when momentum shifts

·         One of the more difficult trades to execute

·         Good risk to reward but difficult to build a big position

Characteristics

·         Identifiable seller on the tape tested at least twice

·         Identifiable buyer drops in pre market or on the open

·         Best entries tend to happen pre market

·         Scalp – Look for targets from previous days

·         Requires a very high level of discipline

·         NEVER EVER double down

The Range Trade

·         Uses support and resistance to enter trade

·         Good cash flow trade.  Not going to make your career as a trader

·         Occasionally can walk into a trend if you take the trade with higher time frame trend

·         OK risk to reward

·         Best in range bound markets at key market support or resistance

Three Day High Growth Stock Swing Play Characteristics


Three Day Growth Stock Swing Play

High Beta Growth Stock

·         NO Ceiling on their earnings

·         Cocktail party chatter / Buzz around the stock

·         Do NOT trade based on Price Earnings Multiple

Determining if it is a growth stock

·         20% or high short interest

·         ATR of over 2 in recent trading

·         Important technical level to trade against

·         Little technical resistance above it

·         Increasing Volume recently

·         Good swing trade / tough to intraday trade

·         History of explosive moves

·         Risk to reward should be 10 to 1 or great

·         Pundits on TV or writing articles about how overvalued the stock is.

Growth company characteristics

·         Significant market share expansion for a new product

·         Most profits reinvested back in company

·         No dividend

·         Increased public interest

·         Polarizing views on companies potential growth

·         High earnings volatility

·         High short interest  

·         Attempts to value company by historic means will ultimately underestimate short term price target.

1st Day

·        Closes above key level.  Showing strength above technical level.  Should be up significantly more than the market.  If market down it should still be up.  

2nd Day

·         Holding above first day highs.  Very little battles.  Keeps going up.

3rd Day

·         Gap higher that fails to hold above highs of the previous day.  Trade needs to be exited.

Will Power

Building Your Trading Willpower
Consider the following scenarios:

*  We decide to enter a position at a particular price level, it hits that level, and we create an excuse and fail to take advantage of an opportunity;

*  We set a stop loss on a position, but rationalize staying in the position when that level is hit, creating a loss that wipes out many days of gains;

*  We establish a process for researching markets and keeping ourselves in peak condition, but become distracted by life events and fail to follow our process;

*  We take an unplanned trade after losing money and widen our losses.

In each of these cases, we have what traders commonly call a loss of discipline.  In fact, it is a failure of willpower:  an inability to sustain intention.

Our focused attention--our intentionality--is a finite resource.  It becomes fatigued with use.  When we frame trading problems as one of lack of discipline, we treat our challenges as character flaws.  When we frame trading problems as one of lack of willpower, we open the door to strategies that preserve the willpower we possess and expand our level of willpower over time.

We are like houses with leaky windows:  we lose energy no matter how much we turn up the heat.  In such a house, you would close windows and seal the areas around them.  You would minimize leaks.  Think of all the willpower leaks in your trading house:  the lost energy staring at screens and fretting over price action you can't control (and that is noise relative to your trading horizon); the poor eating and sleeping patterns; the emotional drains of negative self-talk.  With diminished willpower, we are much more prone to distraction, much more likely to betray our best planning.

If willpower is indeed like a muscle, then the most promising strategy for trading performance is systematically exercising and strengthening that muscle.  As in the gym when we build strength, this means sustaining effort just beyond the level of our comfort zones.  This can be any effort, whether it's spending quality time with children, cleaning the house, reviewing charts, or preparing a meal.  What we do with extra effort builds our capacity to sustain effort: that extra dollop of willpower becomes our new equilibrium point.

When we cut corners and avoid effort, we erode willpower.  Like any muscle, it atrophies with disuse.  The wrong lifestyle makes us progressively less fit to trade successfully.  How we live our lives outside of trading is the best training for proper trading psychology.

Friday, April 29, 2016

IV Skew Modeling

1. How to benefit from the butterfly price table? – I use it to help my entry and exit. After you have done this enough time, you will roughly know what butterfly should cost for similar implied volatility (IV) and days to expiration (DTE). This info will help to avoid or to take advantage of temporary butterfly mispricing.
2. How does IV skew affect butterflies? IV skew affects both prices and greeks but the delta is specifically important in trading M3. Firstly we must understand two aspects of the IV skew – (a) the slope and (a) the shape. Look at the IV curve – the left is roughly linear and then about 40 to 50 pts above at the money (ATM), it starts to curve upwards.
Kevin Lee-4.20.16 pic 1
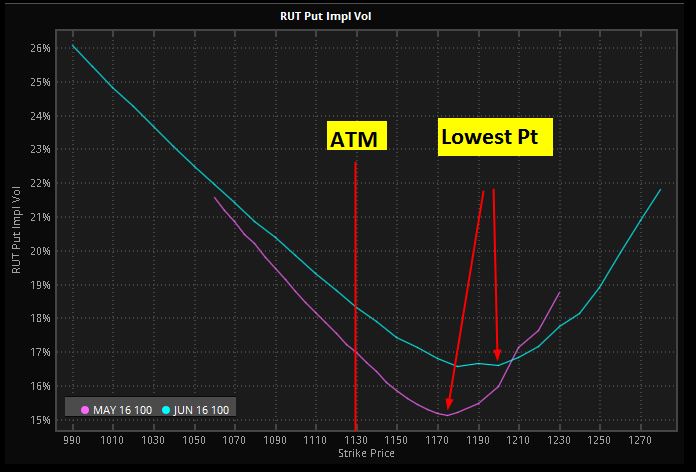
The slope of the linear part typically is steeper when : (a) IV is lower, (b) DTE is smaller.
The lowest point on the curve gets closer to ATM as DTE becomes smaller.
As the market moves up, IV skew becomes steeper, strikes above the market will suffer a bigger IV crush than strikes below the market. Therefore, knowing where the right leg of the butterfly is on the IV curve is important.
Typically after a market sell-off, IV skew will be relatively flatter. For instance, after a sell-off, if RUT is about 10 to 20 pts below short strike of the butterfly, then the right leg will likely be at the point where IV crush will be very severe when the market rebound. In this case, the T+0 line will be inaccurate. It’ll give us a false sense of safety on the upside. That means even if you see a flat T+0 line to the upside, it’s fake. Once the IV crush on the right leg, the T+0 line will sink all of a sudden. That’s because when IV crush, delta becomes much more negative and the P&L suffers more than expected. To mitigate this effect, we need to hedge the upside much more aggressively or pull back the right leg closer, ie turning a regular butterfly to a BWB, or alternatively hedge with more positive that what the software shows.
So we must not think that the lowering of IV is always good for butterfly. That is only true if the IVs of all the legs go down simultaneously. In the real world, that will never happen. As a result, we must not take at face value any of the greeks we see on an analyzer, although OV will be much closer to the truth than TOS or ONE. Instead, we must be aware of where the legs of the butterfly are on the IV curve, understand how individual leg IV will behave and then mentally compensate the greeks.
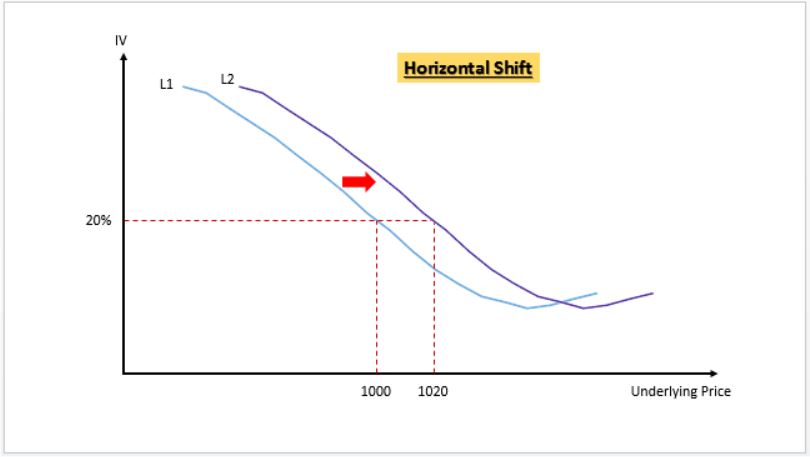
3. Why is the analysis software inaccurate? The main reason is they don’t model the changes in IV accurately. There are three dynamics that need to be taken into consideration : (1) horizontal shift, (2) vertical shift and (3) slope shift. Let me use an example to illustrate. When the market moves up, firstly the entire IV curve is shifted horizontally. Example – if current RUT Is 1000, ATM IV is 20%. RUT moves to 1020. The IV curve will first shift horizontally such that IV @ 1020 is 20%. After this shift the original strike of 1000 actually shows an increase in IV ! See below L1 to L2.
Kevin Lee-4.20.16 pic 2
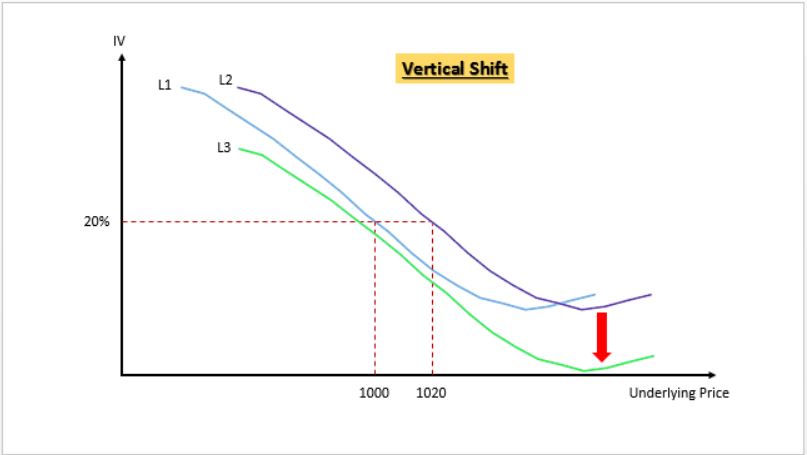
Then step two – vertical shift down. We know that IV goes down as market moves up. The example below – from L2 to L3. So this effect lowers the IV for every strike, countering the increase in IV in step 1. Depends on which effect is bigger, individual IV might end up lower or higher.
Kevin Lee-4.20.16 pic 3
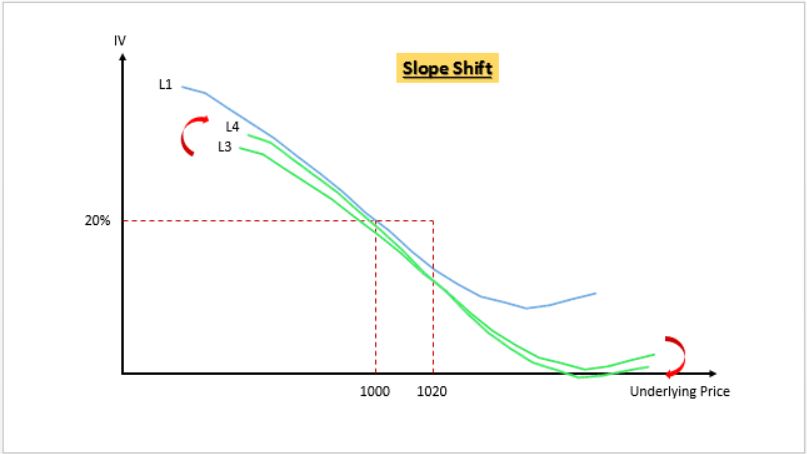
Then step 3 – shift in IV skew. In the case of a reduction of over IV, the IV curve steepens. The example below from L3 to L4. After this clockwise shift in IV curve, some of the lower strike IVs might end up higher than original (ie L4 vs L1).
Kevin Lee-4.20.16 pic 4
To accurately model option pricing, software needs to model all 3 shifts. OV takes into consideration step 1 and step 2 via its CEV. But it does not take into consideration step 3, ie the steepening or flattening of IV skew. Think or Swim (TOS) and OptionNet Explorer (ONE) are worse. They do not incorporate any of the shifts. They assume a static IV curve.
To forecast future IV accurately is not a trivial task. The horizontal, vertical and slope shifts are different for each underlying and these shifts also depend on other factors such as absolute IV level, DTE, and market outlook. To model this accurately, the software must start with an accurate regression analysis of the past data – at a minimum incorporating underlying, DTE and IV level. Therefore, my opinion is that the CEV setting must never be a manually inputted number like in ONE.
4. Why did OV’s modeling create a problem few months ago? It started with OV trying to do a better curve fit. The old projected IV model was based on linear regression. It did not take into consideration of the non-linear part of the IV skew (ie the curving up part). The new model tried to achieve a better curve fit by incorporating the non-linear part. The irony is OV actually succeeded in a closer curve fit, but because OV doesn’t take into consideration of the IV slope change, the net result is the upper strikes IV became way over projected and the overall IV curve became too flat. That created all the problems in T+0 and deltas that we all experienced. Now, they reverted back to a “worse” curve fit but nevertheless a more accurate T+n lines.
What OV needs is an accurate modeling of the shift in IV slope. If that can be achieved, then the better regression model will work. But I know this is really difficult. I hope OV succeeds so we can all benefit.

GG 2nd Day Play 4/29/16


Watchlist 4/29/16

Big Picture 29-Apr-2016
market to open slightly lower after yesterday's powerful reversal. a gap fill on SPY would take us to 206. IWM major support 112.50

stocksupportresistanceinflexionnotestrading plan
p9.6, 1010.50, 11.15solid #s. raised year guidance. bottom should be in
wdc43.20, 4445, 46large guide down. seems to be price in already
amzn658-660, 670680beat rev/eps. AWS huge growth.
stx26, 26.5027.50missed but warned two weeks ago
syna66, 69-7074missed and guided lower

stocksupportresistanceinflexionnotestrading plan
fb116.5118, 118.80was sold all day yesterday
srpt13.40-13.7015failed at 15
aapl93, 9495.5-96sold off on icahn selling stake
twtr14, 14.5015, 15.20closed at low. coming into major support from last Q

Thursday, April 28, 2016

GG Trend Trend Breakout Trade 4/28/16


BSX Trend Trend Breakout Trade 4/27/16


Watchlist 4/28/16

Big Picture 28-Apr-2016
market gapping lower following failure of Japan to offer any more QE.

stocksupportresistanceinflexionnotestrading plan
fb118-118.50nonebeat estimates easily. signs of euphoria
f13.50-13.7014.4, 14.60beat eps by 10%. gm sold off w/ similar scenario
abt38.80-3941.50-4240buying STJ
srpt12, 12.5014article says FDA left door open for approval
yndx18.20, 18.519.80-20, 21beat by 5%. raised guisance

stocksupportresistanceinflexionnotestrading plan
aapl9798-98.50, 10097.50bid all day. 98-98.50 tough area
twtr14.50-14.6015, 15.20very weak
cmcsa61-61.2061.60-61.75prift taking early then bounce to middle of range
bsx21.50, 21.75nonevery strong

Wednesday, April 27, 2016

Three Types of Intraday Traders

Momentum Trader
  • Tick / 1 min chart
  • Best in high volatility markets
  • Strong information processing skills
  • Very high volume trader
  • Tick most comparable to tape reading
2 Min Technical Trader
  • 2-3 min charts
  • Trader will trade every change in direction
  • Trades all breaks of consolidation areas
  • Attempts to capture all trends every day in all directions
Big Picture Trend Trader
  • 15 min chart / 5 min for finding key level and managing risk
  • Identifies strong and weak stocks in the first 30 - 45 min
  • Manages around a core using 5 min chart
  • Most likely only capturing the strongest trend for the day
  • Positioned very well for overnight risk / swing trades
  • Swing trades in good markets

Watchlist 4/27/16

Big Picture 27-Apr-2016
markets set to open flattish despite the blood bath in AAPL. oil making a new high in pre-market.

stocksupportresistanceinflexionnotestrading plan
aapl93.80-9496.6, 97-97.20, 98weak #s. china awful.
twtr1516missed guided down.
dwa30-3133-34comcast wants to buy them around 36/share
cmcsa60.70-6162.60, 63solid #s
bsx19.80-2021beats and raises. no resistance.


stocksupportresistanceinflexionnotestrading plan
srpt1011.511bought all day
fcx11.20, 11.411.80-12morning dip then bought rest of day
tmus38.50, 3939.75, 40sold all day
fb106.50-107109108weak with other technology. reports after close